An alpha approach that breaks from the pack

How the PineBridge Global Focus Equity team retains their edge

Neutral, all cap, and all market

Recent years have seen turbulent markets as the pandemic, global conflict, inflation fears, and rising interest rates dominated headlines. Nonetheless, PineBridge remains constructive on the long-term outlook for alpha generation from global equities.

‘A multi-year capex cycle is just beginning, with enormous investments needed, particularly in renewables and digital transformation,’ said Robert Hinchliffe, Portfolio Manager and Head of Global Sector Cluster Research. ‘Companies that seize the opportunity are likely paving the path to sustained alpha.’

Even amid the challenging conditions of the last few years, the PineBridge Global Focus Equity fund has delivered excess return versus the MSCI ACWI and its peers,1 thanks primarily to a focus on differentiated alpha exposure and portfolio construction designed to minimise all unwanted risks, according to Hinchliffe.

‘We manage a high-quality, differentiated portfolio – the overlap between its holdings and those of other managers in our competitive universe is only 12%.2 This has produced strong risk and reward characteristics in what have been some of the most challenging markets that we’ve seen in almost a lifetime of investing,’ Hinchliffe said.

Bottom-up stock selection – with a strong emphasis on company ESG criteria – has been the key to this differentiation, he noted.

Carmignac ad banner
Mobile Carmignac ad banner

PineBridge’s proprietary process

The stock selection process is driven by a proprietary investment framework: Lifecycle Categorization Research (LCR). Hinchliffe said: ‘LCR is all about understanding the characteristics of a company and, based on those characteristics, the right way to analyse a company – essentially, understanding where a company is in its life cycle and what the future looks like for that company. Is its growth rate accelerating or slowing? Is it maturing, or is the growth rate picking up again?’

The LCR framework helps managers to categorise where a company is in terms of its life cycle maturity. ‘For example, a “High Stable Growth” company will have different drivers than a “High Cyclical” or “Mature” company. It’s important to note that companies can move left and right in this curve – and that can be a great source of alpha if a company is moving right to left, going from a relatively slow-growing to a faster-growing company,’ Hinchliffe said.

When evaluating companies, PineBridge’s due diligence approach can be divided into three major buckets: governance and leadership, business sustainability, and financial strength. ‘It’s about understanding the nuts and bolts – competitive advantage, industry structure, management and, of course, ESG,’ Hinchliffe said. ‘We use a forward-looking perspective, and ESG metrics are ingrained into that. All of these factors help us to assess a very specific alpha source we are targeting: the positive, gradual change in companies over time.’

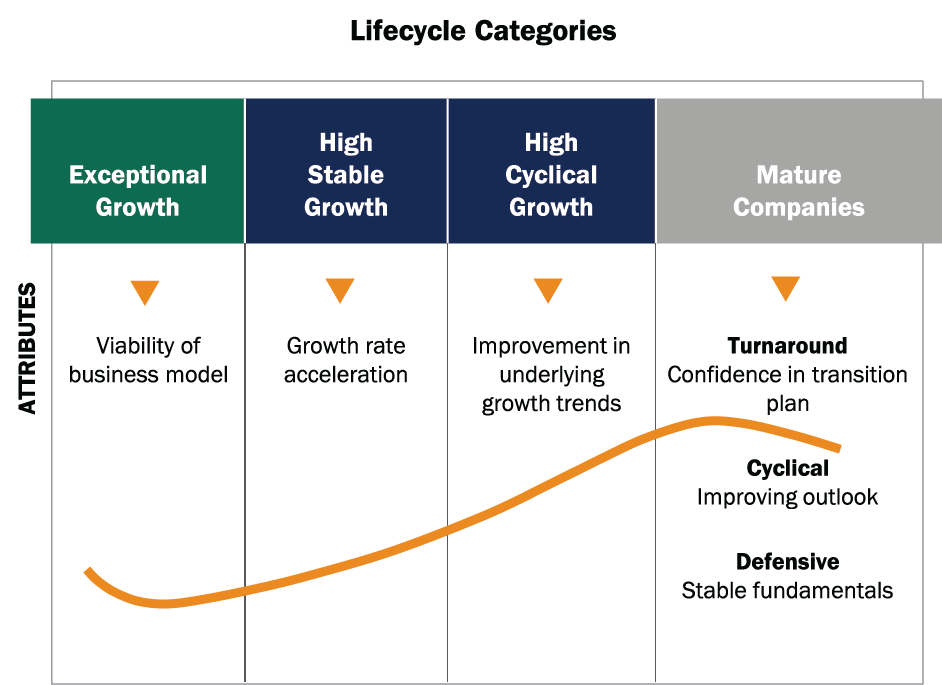
LCR is a key differentiator of PineBridge’s approach to equity selection, ‘Most investors manage portfolios based on MSCI sectors. We don’t do that, Hinchcliffe added. We have our own segmentation approach that divides the entire market into six homogeneous groups – or life cycle categories. These essentially follow the life cycle curve of any company, from early stage to very mature.’

Seeing the patterns

The point of establishing these homogeneous groups, based on a company’s growth stage relative to its stability, is that irrespective of sector, companies within a particular grouping behave very similarly in the market. ‘In a way, the six life cycle groupings are style factors. This enables us to be very precise about our risk controls,’ Hinchcliffe said.

‘LCR means we have a very good sense of the different exposures within the benchmark,’ Hinchliffe explained. ‘When we construct the portfolio, this means we can do it by taking the risks we want. For example, if we have uncovered opportunities to invest in companies that will benefit from a particular long-term trend, say supply-chain near-shoring, we can do that. But at the same time, we want to minimise other risks. So we construct the portfolio to be neutral to, say, commodity prices.’

Using Global Industry Classification Standard (GICS) sector categorisations is an imperfect way of managing risk. ‘If you take consumer discretionary, you have companies like Amazon, Tesla and GM all within that category. And if we look at just the two auto-makers – Tesla and GM – they have totally different drivers’.

“We run a differentiated portfolio, with low correlation to the broad active equity universe of managers, and a proven track record of excess return versus our peers and the benchmark”

Robert Hinchliffe
Portfolio Manager and
Head of Global Sector Cluster Research

Leveraging a global team

With a global portfolio, the breadth and organisation of the investment team is key to alpha generation. ‘We have over 40 investment professionals around the world. This gives us a wide opportunity set in terms of finding alpha,’ Hinchliffe said.  ‘But the key is collaboration – which is the source of our idea generation – and our setup is designed to maximise this. Our team is organised around global industry clusters that help us maximise the value of the thousands of company meetings we undertake each year.’

According to Hinchliffe, the cluster framework is designed to increase this flow of ideas. ‘Each of the five industry clusters – tech, consumer, healthcare, financials and industrials – meets once a month, and the whole point is to share information and maximise the value of the insights we have. Having people in our Taiwan office, for example, is a significant advantage when it comes to understanding the global semiconductor chip shortage, while our people in Hong Kong and Shanghai are vital to understanding the reopening status of China’s factories as the country comes out of lockdown. And then, our analysts on the ground in Kuala Lumpur give us information about the status of soft commodities .’

The ability to take a comprehensive view of a given industry or company leads to a differentiated perspective. ‘Somebody looking at certain large companies in the US might have a certain perspective of that industry,’ Hinchliffe added. ‘But if you have a globally connected investment team that is looking at the same set of facts and data, the perspective is different, giving a richness of information that is very valuable as an investment tool.’

All of this means that the fund has consistently delivered alpha in a wide range of market conditions with a tracking error of 4.6% since inception,3 he noted. ‘We have no investment-style exposure. We look very different from the benchmark with respect to what we own, and very similar to the benchmark in terms of its other characteristics.’

1 Morningstar, as of quarter ending 31 December 2022. The fund delivered returns higher than the benchmark (MSCI All Country World Index (ACWI) Daily Total Return Net), over 3 years. The fund delivered returns higher than the peers (Peer Group: Morningstar Global Large-Cap Blend Equity Universe) in one-, three-, five- and 10-year periods. Fund performance is reflective of Share Class Y USD. The fund performance is calculated net of fees in USD with dividends reinvested. Past performance does not guarantee future results.

2 Source: Morningstar as of 31 December 2022. For this calculation, Morningstar finds the common holdings for the two investments. We then determine the percent each common holding represents in the two investments separately and discern which is the lesser percentage, and then sum these lesser percentages.

3 The tracking error is calculated as the standard deviation of monthly excess returns versus the MSCI ACWI NR USD since 01 January 2016 (start date of the lead Portfolio Manager) through 31 December 2022. The excess return correlation is calculated as the correlation between PineBridge Global Focus Equity’s monthly excess returns over MSCI ACWI NR USD and those of the competitor funds since January 2016. Bubble size reflects AUM size of the Fund. Diversification does not ensure against market loss.
^ Jump to top